Research simulator for human factors research and science education
There is a wide range of variables that can easily be measured at a high sample frequency, such as, time-headway, time-to-collision (TTC), time-to-lane crossing (TLC), speed, acceleration, lateral acceleration yaw-rate, etc. Also the position of steering wheel, gas pedal, brake pedal etc. can be sampled with a high frequency. In addition, the user can define and compute dependent variables in script, and sample these with a specified sample frequency (usually 10 Hz). These variables can then be used to derive other measures such as standard deviation of lateral position (SDLP) and brake reaction time.
The variables can be sampled and stored as binary files or ascii files for offline data analysis. Also, during an experimental trial, data can be measured and analysed, and stored as text files, to give for example SDLP, speed variability, or average speed on a specific road, and many other measures immediately after the trial or to be used during the trial.
Data can be inspected and analyzed off-line with a specially developed software program or imported in a spreadsheet for analysis.
Standard tasks such as the Detection Response Task (DRT) (previously known as Peripheral Detection Task (PDT)) and brake reaction time task during car following are implemented and can be controlled during the experiments. The research driving simulator is suitable to investigate the effects of distraction, secondary tasks, in-vehicle devices etc. on workload and primary driving performance and human factors experiments involving car driving.
The integration with PsychoPy enables you to create experiments in various fields of cognitive psychology, human factors research, cognitive neurosciences and other branches of psychology, psychophysics, medical research and engineering. PsychoPy is an open-source application to allow the presentation of stimuli and collection of data for a wide range of neuroscience, psychology and psychophysics experiments (from the website of PsychoPy), and is used by numerous university departments all over the world.
More information on research driving simulators can be found here….
Road design software
 Select a database from a large number of available databases. Databases can be viewed in a database viewer. Each database has a graphical file and a logical file with road descriptions. The experiment scripts refer to these road characteristics and load the graphical database.
A selection of 15 databases is available to choose from. The databases are detailed and realistic sceneries, some are very large, spanning an area of tenths of kilometers wide, while other databases are smaller. There’s a very extended database that covers a rural area, a few highways databases, one with a city environment, another with a small village, there’s a motorway database, one with small roundabouts and another with large roundabouts, etc. Some databases have traffic lights.
The user can easily add, change or remove 3D models. New databases can be made as a commercial service. Databases are provided with the road signs and markings for the country where the customer resides. More information on the road database design software can be read here….
Script language
 An easy-to-learn script language allows the experimenter to define the experiment.
Design the experiment with pre-existing or new scripts. Scripts are then compiled into a binary format and errors are checked by the script compiler. Scripts are written in the proprietary Scenario Specification Language format.
In the scripts the complete experiment is specified: when to start and end datasampling, traffic generation, communicating with other computers, secondary tasks, verbal feedback, engine characteristics, etc. The package comes with a lot of scripts you can use in your own experiments.
Examples of special effects such as night driving, rain, snow or fog are included in script files.
It’s easy to use the scripts to communicate to other computers via UDP. This allows you to run, for example, a MATLAB application on another computer and send simulator data (for example velocity, steering wheel angle, etc.) from the research simulator to that application. Alternatively you can send data from another application to the research driving simulator, and receive it in your script to be handled. By this mechanisms you can also control things in the simulation from outside. As an example, you can send over data from the simulator to an external IVIS or simulated IVIS.
The script language allows you to:
- Define traffic, depending on location of the simulator car and various other conditions, including all kinds of properties of traffic (rules used etc). Behaviour of other vehicles can be fully controlled.
- Because the scenario system is fully interactive, scenarios can be started depending on the current state, for example, at a specified distance to an intersection, when in first gear, when speed is higher than a specified limit, etc.
- Start animations
- Give verbal (spoken) instructions, feedback or show graphics on the display (*.jpg or *.png files).
- Store data to files or read data from files.
- Create events (written to an event file) for data synchonization
- Sample all kinds of dependent variables such as speed, state of actuators, acceleration, yaw rate, time headway, etc.
- Make connections to an external computer via the UDP protocol.
- etc.
More information on the script language software can be read here….
Define data for data sampling and processing
 Define the data to be sampled and the sample frequency (typically 10 Hz). Data consist of continuous variables, such as vehicle speed, acceleration, lateral acceleration, steering wheel angle, yaw rate, time to collision (TTC), time headway (THW), Time to Line Crossing (TLC), lateral position, vehicle RPM, brake pedal position, etc. In addition, discrete variables (for example road segment number) can be selected which makes data analyses easier. You can also create your own datafunctions (in scripts) and add these as well. During the experiment, events can be generated and stored in eventfiles that are synchronized with the datafile. Data can be stored either in a binary format, to be inspected and analysed via the dataproc software tool, or as a table in text file format (suitable for input in excel).
Via a software tool you can prepare experiment files, one for each subject, with data to be stored and the script to be used.
In script, functions are available to not only sample analog data with a fixed sample frequency, but also to process data during the experiment. For example, to compute the standard deviation of lateral position over a certain stretch of road, and write the already computed data to an ascii for for later analysis. This is a great way to save time because data preprocessing is done automatically.
Access to the rendering engine
Users of the research simulator software have full access to the rendering engine via python scripts. This allows you to add graphical effects, objects and directly influence the graphics in general. All python scripts for rendering are included. You can also add vehicles, create animations and use these animations in the scenario scripts.
Data inspection and analysis
 The datafiles, with all data sampled with a fixed sample frequency (typically 10 Hz), are inspected and analyzed with specially developed data analysis software. Data can also be exported as an ascii file for analysis by other software packages. But data can also be analyzed already during the experimental trials in script, for example to compute SDLP (standard deviation of lateral position, a measure for the amount of swerving) over a specific part of the road network. The data are then already preprocessed and ready for statistical analysis.
Data analysis can be complex or simple. If you want to use advanced statistics, the data can be entered and analyzed in SPSS. Data can also be analyzed in Excel.
Data can be searched for specific events or positions in the database. You can define datablocks and computer the mean value, standard deviation, minima and maxima, etc. Data can be related to each other, for example, to relate steering wheel angle, yaw rate and TLC, or to determine brake reaction time, minimum time headway etc.
Tools
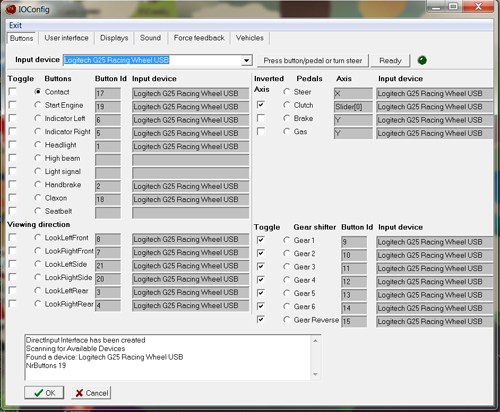
The research simulator software can be configured by the user to use other screen resolutions or input devices. This makes it easy for you to connect a different steering-wheel, pedal set or other input devices to the system, or effectively build your own hardware system. Any actuator can be added as long as it connected via USB.
Display resolution can be set easily, as well as force feedback settings and graphics effects (for example to apply shadows or not).
Services
In addition, Carnetsoft offers consultancy services to help to setup and implement experiments with the research driving simulator or to make databases. The director of Carnetsoft, dr. W. van Winsum, has developed the Peripheral Detection Task (PDT, now DRT, see Van Winsum, Martens & Herland, 1999), that has been succesfully applied in numerous studies into workload and distraction, since 1999. He also has extensive experience with human factors research using research driving simulators and in the measurement of driving performance and driver behaviour modelling.
Go to:
Research simulator- Page 1
Research simulator- Page 2
Research simulator- Page 3
Research simulator- Page 4