IMPORTANT NOTIFICATION
The driver training software for driving schools has been terminated. Carnetsoft specialized in research simulation software and clinical applications and this takes up all available time and resources. This means that Carnetsoft has stopped selling the driver training software to driving schools and secondary schools or any other clients that provide driver training services.
However, the driver training package is still included in the research simulator software package.
Student Assessment System
The Student Assessment System (SAS) is the central part of the simulator training. Every student has a spreadsheet (Excel spreadsheet) with the results stored. The open source software package ‘OpenOffice’ is installed on the computer. This is used for opening the spreadsheets and for printing reports. Each student has a separate spreadsheet to store the progress data. When a new student starts the training, a new spreadsheet has to be created for that student.
The student assessment system keeps track of all progress the trainee makes during the driver training curriculum. It does the following:
- Maintain a record of all lessons completed, when they were completed, the grade (between 0 and 10), whether the student passed or failed for the lessons.
- Suggest which lesson should be done next, although this can be overruled by the trainer.
- Provide a print page with a summary of results after each lesson. This summary can be printed and contains information on fuel used, and a grade of the relevant driving tasks (for example speed control, use of indicator, visual scanning, lane keeping etc) for that lesson.
- Maintain a record of detailed task performance for each lesson. For all relevant driving tasks, the nummer of errors are listed, together with a grade for each separate driving task and a grade for the lesson as a whole.
- Store the data in a strenght/weakness analysis so consistent types of errors committed in all lessons can be detected quickly.
Add a new student
On the desktop, there’s an icon ‘NewStudent’.
– Double click the icon ‘NewStudent’
– Type the name of the new student, for example, John Miller, then press the button ‘Add’.
– Check if the new spreadsheet with that name has been created by pressing the ‘Show students’ button.
– When you’re ready, press the ‘Done’ button.

Start a lesson from the SAS
When the SAS is opened , a student must be selected. On the left side of the SAS panel there are a number of buttons:
Control simulator:
- Select student. With this button a file of an existing student can be opened. To create a new file for a new student, see the previous paragraph.
- Start Lesson. This button starts a selected lesson for the selected student.
Navigate in SAS: these buttons can be used to navigate to a certain tabsheet in the spreadsheet.
- To selected lesson. In the ‘Overview’ tabsheet there’s an overview of all lessons. A lesson can be selected by clicking on the row with the name of the lesson.
- To overview. Navigate to the ‘Overview’ tab.
- To report. Navigate to the report tab (print page) to print the report.
Report: After each lesson is finished, the results of the lesson are filed in the tabsheet of the respective lesson: each lesson has it’s own tab. But the system also makes a report of a single page which gives the results in summarized form. There are two possibilities: after each lesson is finished, the SAS creates a report. This can be printed by the operator. Another option is to make a report of another lesson that has been driven before (and thus was not the latest lesson). For that purpose the ‘Make report’ function can be used.
- Make report. To make a new report (apart from the automatically generated report of the latest lesson), do the following. First go to the ‘Overview’ tab and select a lesson by clicking on the name of the lesson. Then jump to the tab of that lesson by clicking on the ‘To selected lesson’ button. This shown the tab of that lesson. When that lesson has been driven at least one time, a report can be generated of the last time this lessen was done (by the present student). To do so, click on the ‘Make report’ button. This can take a few seconds, and then the SAS jumps automatically to the ‘Report’ tabsheet. This then gives a summary of the results of that lesson. Some fields are empty, like fuelconsumption, because that data is only available if the lesson has just been finished: it is not stored in the SAS.
- Print via OpenOffice. This is to print the report, by calling the program ‘OpenOffice’.
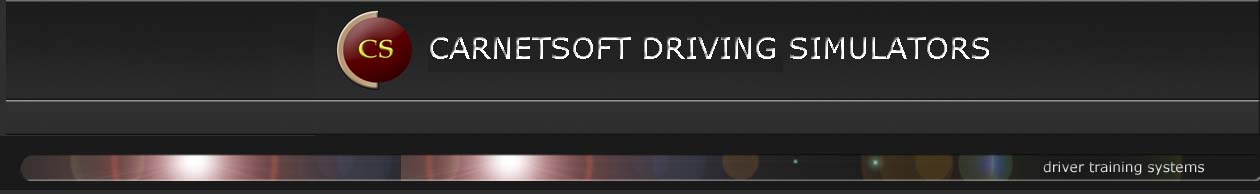
Select a student by clicking on the ‘Select student’ button. A file selection dialog opens and a student can be selected by clicking on the name. When the button ‘Open’ is pressed, the student data are loaded.
When the button ‘Start Lesson’ is pressed, a file selection dialog appears with the name of the selected lesson filled out. By pressing the button “Open” the lesson is started. The SAS disappears from the screen and the control panel of the simulator is put on the foreground.
A lesson can be ended in two ways:
- When the lesson is finished, this is detected by the simulator software en the Virtual Instructor (VI) indicates that the student has to stop the car. The student then has to follow these instructions (stop the car and turn off the engine). Then the simulator closes the lesson and sends all performance data to the control program. This stores the data in the SAS of the selected student.
- The operator may finish the lesson by pressing the ‘Stop Lesson’ button. The lesson then stops and all data are sent to the control program. This stores the data in the SAS of the selected student.
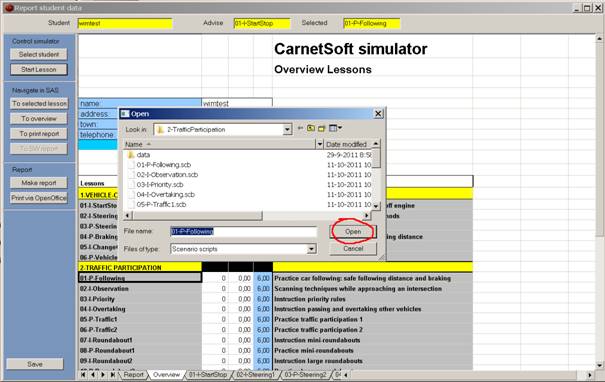
When a lesson has been started from the SAS, the report is shown after the lesson has been finished, see figure. This shows the summarized results of 05-P-Traffic1, together with the date, time, distance driven and fuel consumption. The grade was a 7 and the students passed. There have been a couple of errors:
- On the task ‘Speed control’ speed was too high. This did not occur often, resulting in a 7.0 for that task.
- On the task ‘Car following’ headway was too small. The grade on that task was a 8.5.
- A number of tasks have not been measured and have no grade (NA = Not Applicable).
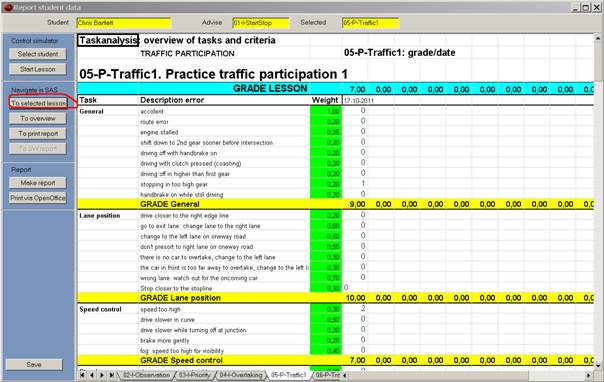
When the button ‘To selected lesson’ is pressed, the SAS navigates to the 05-P-Traffic1 tab. This gives more detailed information for each driving task. For example, the driver error ‘Speed to high’ has been registered twice.